Constellation
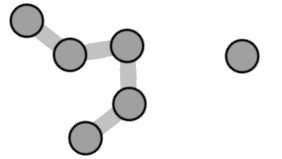
Spot critical relationships and hidden dependencies in seconds using Constellation to simplify interconnected data into an easy to use and accessible Network Diagram.
Constellation for Power BI is a powerful visual designed to help you instantly uncover critical relationships and hidden dependencies in complex data. By transforming interconnected information into an interactive network diagram, Constellation enables users to visualize connections and patterns that would otherwise remain buried in traditional tabular views.
Built with accessibility and simplicity in mind, Constellation requires only three columns to function: Source, Target, and Distance. Additional columns can be used to customize links in the data and Formatting Parameters can be used to customize individual nodes.
Whether you’re mapping workflows, customer journeys, system dependencies, or any other web of relationships, Constellation helps you see the full picture with clarity. The visual aggregates source and target nodes into a single graph, allowing for intuitive exploration while maintaining analytical depth.
Designed specifically for Power BI, Constellation integrates seamlessly into your reports and dashboards, empowering decision-makers with interactive insights that reveal more than just numbers — they show connections.
Instructions
Import the visual into Power BI and add the three required columns:
- Source nodes
- Target nodes
- Distances
Source nodes and Target nodes are aggregated together to form the final graph (though you will only be able to select the source nodes) with distances being a numeric value that determines the distance of one node to another.
with the “Source” and “Targets” columns being treated as an Adjacency List and every other column being treated as an attribute of that connection, for example:
| Source | Target | Distance | Fill |
|---|---|---|---|
| A | B | 30 | “#ff0000” |
| B | C | 90 | “#00ff00” |
| C | A | 80 | null |
| C | null | 50 | “#0000ff” |
In this example, Fill would be an attribute of the connection between Source and Target, not a value of Source or Target. The row with a Source of “C” , a fill of “#0000ff” and a Target of “null” would add nothing to the visual.
NOTE: when distances are not required, a simple workaround to having all three columns is to create a calculated column with a value of
50, then pass that value into the distances parameter.